Tuesday, April 5, 2011

Update...


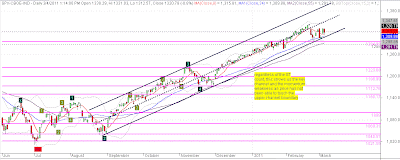
Not much progress has been made in either direction the past few days. Either the bears take over soon or the bulls will drive this much much higher. The aggressive short would be to short the open if we open below ES 1325. A more conservative short would be to wait for a move below ES 1320. Anything above 1325 at the open leaves the door open for the bulls to run it up.

Sunday, April 3, 2011

Option #2 and where we are...


As the market barely flinched last week at the 786 retracement from the highs, it became apparent that we weren't going to see new lows before we saw the highs tested.

So, that brought another look at the larger count to see where we might fit in. Symmetry between waves 2 & 4 are always something that I'm looking for. Corrective waves are so often a fib ratio with each other. So which corrective wave did this last move down fit with?? The wave 2 flat in a perfect 1:1 ratio. So there you have it: wave 2 flat, and wave 4 zigzag. We got perfect symmetry and an alternation.

Where do we go from here? The obvious is to look for a daily reversal of our 5th wave at key targets.

Key targets:

#1 Friday's high. It gives us a double top, a wave 5 = wave 1 symmetry (I labeled it .786 on the chart but that was because I first measured to the wave b high of the flat), and a perfect turn at the daily rsi resistance line. Any open below ES 1320 is shortable at the open. A daily reversal would be a close below 1325.

#2 Should the bulls come out tomorrow and push this up, then my next target is 1379 or the channel resistance line, whichever comes first. On a weekly basis, I would expect the rsi never to break the 80 level (it closed last week at 65).

Best of luck, and watch for the confirmation before getting aggressive.

Sunday, March 27, 2011

Okay - I'm Awake!


Okay already, I'm back to make an EW count. First off let me say that the bulls are really sticking it to the bears and the last week has been a perfect example. They have driven through resistance lines without even flinching. What value in the future they see, I have no idea, but there are enough of them that they are overwhelming all the sellers.

So, here are my counts:

#1 - We just completed an A-B-C-X and have an A-B-C to go.
#2 - We just completed an A-B-C and are going to take out new highs.
#3 - The market is very very wicked taking in all the buyers in an incredible wave 2 that fails tomorrow and continues to impulse down for weeks to come. I know, not likely, but someone has to put it on the table.

The market has already broken a weak channel resistance line and looks like it may be vulnerable at the 786 retracement zone. A gap down tomorrow is shortable.

Wednesday, March 9, 2011

Triangle Update


Yesterday saw what appears to be the last test of the support line and an upward explosion. The momentum was so fierce that it eclipsed the momentum of what I'm labeling the 'b' wave of 'C' leg of the triangle. This will be confirmed with a close above yesterday's highs. Assuming we don't get a 5th wave extension out of the triangle, which I'm not as this rally is already over spent, I would expect the 5th wave to end in the 1354/1360 area based on the size of the triangle.

Monday, March 7, 2011

Update demanded by ME


Wow, can you get both scenarios so wrong??? Today's move down leaves us pretty much where were over the weekend, except the count has expanded.

Primary Scenario: Triangle has now moved up to my primary count based on the futures movement after hours. An open below today's low would eliminate this count.

Secondary Scenario: Added another subdivision to the wind up today. Tomorrow will open below today's low.

There you have it. Today cost me....

Sunday, March 6, 2011

Weekend Update


I realize there were some violent swings during the week, and I apologize for not chiming in with my views on market action. So, now that I've had some time to analyze the charts, here are my two scenarios:

Primary Count: Monday kicks off a 3rd of 3rd down. It starts with an acceleration gap below Friday's low and possibly below last week's low. This should be pretty easy to invalidate based on where the futures are trading tomorrow morning.

Secondary Count: Friday finished of a 4th wave triangle and began the 5th wave. It only matters that the market opens above 1315 and takes out 1320 within the first 15 min of trading.

The bearish count takes the primary count due to the VIX movement, the weekly reversal, Thursday's double top failure. We soon shall see...

Sunday, February 27, 2011

Weekend Update


Okay, first off I need to apologize for the lack of content. Truth be told, I've been spending most of my 'free' time on my automated trading system. With that said, look for a couple of posts a week to keep the big picture in perspective.

Last week gave us our first decent drop in a LONG time. In fact, we haven't had a weekly reversal signal since 8/13/2010. That one led to about a 90 point drop over 3 weeks. Nothing too exciting. The time before that was 6/25/2010, which led to a 125 pt drop over two weeks. That was quick and short lived...

Our last drop of any bear value was the flash crash that started on 4/30 and lasted 4 weeks after a drop of nearly 180 pts. So as this correction unfolds, we will keep an eye on those numbers.

From a technical perspective the 1200-1220 area is very important for the bulls. Should we get more than a couple of weeks of selling and 125 pts (which puts us in the range), then the bulls are in trouble. Look for a ton of buying to come in that area to end our correction (should it be that) or our wave 1 (should primary wave 3 have started).


The short term count down can be counted a couple of different ways depending on how you count the end of the previous wave. I lean slightly towards the wave 2/b flat pattern, but I wouldn't be surprised either way. The short line for this week is follow through so that we have another couple of red candles before March opex week.

Wednesday, February 16, 2011

Divergence is building...


We got the test of the trendline just like I was forecasting. The bulls were there to buy it up, so we had no break.

And now the market is gearing up for a big move: up or down. The RSI divergence is pointing down, but will the buyers come out in droves and cause a short covering rally? That is where we are and tomorrow should prove out.

Tuesday, February 15, 2011

Morning update...


Prices are in retreat once again this morning. The 1325 level in the futures is a key level to watch. A move below that could provide some selling that this market has not been inclined to do. Still watching....

Thursday, February 10, 2011

Count update


So we got some kind of correction off of my top labeling. So far nothing of significant size. The top label is either the end of our pattern or it was the end of subminuette 3. If that is the case, then we should see some more bouncing around but buyers should keep price above 1310. We're getting very close to that number in the futures, so it should be interesting to see.

A bearish count would see yesterday's price movement the end of a wave 2 irregular flat. Today's gap down will be an acceleration wave 3. Keep that in mind as price action unfolds.

Tuesday, February 8, 2011

Quick update


Sorry for not providing more timely updates, but the market hasn't been giving us much to work with. We're nearing a potential 5 wave pattern, so I thought I would at least give you a heads up. This last wave has been one that doesn't want to end!

Still looking for a close 1310 for an early signal that this wave is finally over. But we'll need to see something more impressive than one day of selling.

Wednesday, February 2, 2011

EW Count Update


Well, as my primary count obviously didn't prove out at the impulsive move on Friday was wiped out yesterday, I move to my next preferred count: wave 4 flat. Looking at the lowest level charts, I expect this final wave to finish in the 1310 area. We won't have full confirmation of the next move down until we break Friday's low, but a move below the 1290 at this point should tip us off.

Best of luck!

Sunday, January 30, 2011

Weekend Update


The correction (minor 2) / or impulsive (primary wave 3) has begun. After going through my counts, it looked like I gave too much to my minute wave 4 with a truncation. But with Friday's sell off, the updated count looks perfect: alternating waves, and good wave 2/4 ratios.

The big question, of course, is this the start of minor wave 2 or the beginning of Primary wave 3. You all know where I lean, but I'm willing to take it one day at a time. If this is minor wave 2, then we should see the buyers come in hard in the 1175/1220 zone. My target for minuette wave 1/a is 1260.

Best of luck!

Thursday, January 27, 2011

What a mess...


I haven't put any updates in since the weekend because right now the wave count is so messy that I'm left with too many options. So, this is the time to take a step back and wait for the market to give us some better options. Since my wave count on the weekend update has been invalidated, that leaves me with a 5th wave extension. However, the price action has been a choppy upward grind...possibly ending diagonal? May the market show the way...

Sunday, January 23, 2011

Weekend Update


After a review of the charts, we are still at the beginning of the next wave down. As I have said, we don't know if it is minor wave 2 or the start of primary wave 3. Both are on the table. Those of you who have followed my blog know that I'm still a believer in primary wave 3. An economy that is still built on gov't bailouts is no economy ready for a new bull market. I believe history is on my side, but in the end the charts are all that matter. So, I will be objective in my charting as price action unfolds pieces to this puzzle and eliminates different wave counts.

As we are starting the potential for a wave 3/c tomorrow morning, I always like to see those start out with an acceleration gap. Let's see where it takes us.

Update on my trading system:
I started trading it with real money at the beginning of January. I've found some code errors and have made some slight modifications. The official trade log, however, shows 3 trades: 2 losers and 1 winner for a net loss of $76.90. Not too much to get excited about, but I'll keep you up to date on how it goes.

Friday, January 21, 2011

So far a nice start...


The correction (for now) started right on schedule. The first move down that ended at yesterday's low appears impulsive. We are opening today at what should be the top of a wave 2/b. How it unfolds from here will be important in forecasting the rest of the year.

Tuesday, January 18, 2011

Important juncture ahead...tomorrow?


We're coming to the end of the rope for the current move up. We should see a correction or an impulsive wave soon (the RSI points to tomorrow). This should prove out if this is a new bull market or the return of the bear. Key support comes in at 1175. Should get interesting....

Wednesday, January 12, 2011

New count needed...


Well, my preferred count went out the window yesterday and is being trampled on this morning with opening pop. That caused me to go back to the daily chart and see where I missed my subdivisions. It appears I counted to quickly my minuette waves, so with that said I have put the waves at the level that now fits well with the daily chart. To sum it up, today's open will be subminuette wave 3 of minuette wave 5. My final target for minuette wave 5 is SPX 1288.

Monday, January 10, 2011

Quick update


Sorry folks another crazy week...

Here's a quick update though from my last post. I was looking for one more high, and all we got was a failed test and a nice reversal. I'm counting the move so far a 1-2. Any buying off of today's gap down should be reversed by mid day for this count to be valid. Let's see if the bears are up for the challenge...

Thursday, January 6, 2011

One more high?


I've been quiet lately as the market has chopped back and forth. I continue to work on my automated program and have it going with real money now. I'll post my first month's results at the end of the month. I'm starting small with 1 contract to see how it fares, but I think it will be a keeper.

Wow, the bulls are really pushing and extending...Today's initial selloff looked like it might have some strength behind it, but there appeared to be an unlimited supply of buyers at today's low. Tomorrow is the unemployment report, and the reaction will be pre-market open.

Here's my forecast:

- if we're going down, then we will open below today's low. This should be sold.
- if we're going to go to one more high, then a move should be good to the 1278 / 1280 area. I'll be looking to short any weakness at this level.

Best of luck!

Sunday, January 2, 2011

Major wave completion any day...


The price action over the holiday weeks was low and choppy. However, the long-term picture is clear to one point: we are at the top of either minor wave 1 (if this is a new bull market) or primary wave 2 (if we are not). Certainly the price pattern that evolves from the coming sell off will tell us: with the higher level trend or against it.

The attached charts show all that we need to know: we are in the final stages of a 5th wave. It comes up on the weekly charts, daily charts and the hourly charts. The volatility charts support a top equivalent to 2007. We shall soon see...