Friday, January 30, 2009

Wave 3 of 5 Is Upon Us


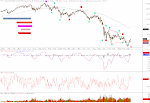
So after the news that the GDP number was better than expected, the market gave you all of 10 minutes before it began another plunge. I've posted here my 'best guess' of the count, but the problem of a wave 3 is that the momentum is so strong you never know if the train is ever going to stop! So even though the pattern 'looked' complete yesterday, it obviously wasn't. And even though I show a pattern that is nearly complete now, doesn't mean it is and that we don't drop another 50 points Monday.

Here is what I suggest. Do not cover shorts or take profits on puts until you know that we are at least in wave 5 of 5. Add to shorts during every rally and be thankful you got a chance. The last thing you want to do is miss out on a massive move because you were tinkering with 10 points of profit.


Ok, so here is what I have: an hourly chart that has stayed below the 8 SMA this whole drop. That is the first clue that we are still in w3. Now, what I would expect is that w3 would subdivide into 5 smaller waves. That doesn't mean it has to. If we break the 8 SMA on Monday to the upside, then that would be my clue that we are subdividing. If we don't, then we will continue to drop to 800. If we bounce Monday, I don't expect any rally to take out the ES 840 area, so add to shorts there if we get one.

I'm showing the NYSE Tick chart at the bottom to show that the broadness of the selling hasn't kept up with the price chart. I use that to show support that after one more brief low on Monday a.m. we could rally to the upside target.

Thursday, January 29, 2009

Strength, did I say strength? I meant, we're going down!!


Today's down moved traced out a perfect impulse wave (see chart above). Since we hit our minimum retrace level yesterday (50%), that means that the odds that the party is over just got bumped up to 90%+. I only hope that the end was at the close today, because I have a lot puts to buy and I want them as cheap as I can get them. We should all pray for decent GDP numbers, because we don't want to spook the bulls before the market opens tomorrow.


At this point it important to step back and look at the big picture. We should get a terminal sell off because we never really got one with the end of w3. This has to be bad to build the base for a multi-month bull market.

Wednesday, January 28, 2009

I'm Thinking a Little More Strength...


Well, today played out exactly like the forecast. That's always nice as it should be showing up in your trading account. Looking at the chart, I don't think it is over quite yet. We're getting some divergences that will likely lead to morning weakness, but until the bottom trendline gets broken or the top trendline gets rejected, I think we are still going up.

I am currently short ES at 872, but I will likely cover tomorrow morning and go long if strength returns.

I also opened 1/5th positions in the following put contracts:
- AAPL 75 Puts Mar09 @ $1.03
- ABX 30 Puts Feb09 @ $.51
- GS 55 Puts Mar09 @ $1.42
- IWM 43 Puts Mar09 @ $1.73
- XLF 8 Puts Mar09 @ $.38

I'm thinking I'll go up to 4/5th at 888, 5/5ths at 900, 7/5ths at 910, and 10/5ths at 920. If we make it that far then I'll end up having a 2x position (for put contracts). I'll likely keep daytrading the futures until we hit the top of the trendline or break it. I'll only do 1x position with futures.

Tuesday, January 27, 2009

Breakout Tomorrow?

Well, I have to say I was a bit disappointed with the bullish action today. I had to close out what I thought were going to be great daytrades for a small profit at the close only to see my profit targets hit after hours. Oh well, at least my swing positions are still making money.


I'm reducing my target after today's action to the light blue zone shown above. This absolutely is not to say that we can't get a rally higher, but unless the bears take a rest, I just don't know how the bulls are going to do it. They must be tired having fought to stay their ground for the past week with little to show for it. That being said, I'm going to move my triggers to start kicking off at 870 instead of 880.

As you can see on the 15min chart, I've highlighted some fibonacci clusters where we have a wave A/C relationship. These are not required turn points. Instead, I use them as a guide to start watching for reversals. It is because of these clusters that I'm moving my target down to 870. At 870, I'll start my short positions.

Monday, January 26, 2009

We've Made Some Progress...


Well, today was constructive. As noted in the above chart, all of today's trading range was in the upper half of the trading range from the last 5 days. In fact, we even poked above it in the morning. But, keep an eye on the 810 area, for if we see it again, things could get wild.


I'm currently showing wave 'A' and 'B' complete. Although, we won't know that 'B' is complete or even 'B', until we break above today's high. But, it certainly has the 'look' of complete. Wave C=A*1.27 near the 61.8% retracement level. So that is my major target 880-890. I took some profits in the morning and added to my longs in the afternoon. We'll see if we can get some real momentum going. The Bears are still having their way with the Bulls in this one. Wave 'C' should give the Bears a scare before they get to eat again.

Friday, January 23, 2009

The Morning Started Scary...

So when I woke up this morning and checked the futures and found ES sitting at 800, I was more than a little surprised. Fortunately, I was in at 804, so although my profit was gone, my loss was still little. I thought I would give it 10 min and see what kind of strength we could pull off the opening. I closed out my longs around 811, went short around 815 and then closed those out around 810 when the move down lost steam. I put my longs on again with a stop at 807. Looks like I never had to use them the rest of the day!

After the day was over I relooked at the chart. A few things popped out at me, that I'll show you in these charts.

This is a 15min chart showing that my previous wave 4 label was a bit premature. This labeling actually works better because it gives us some nice alternation between waves 2 & 4, which is common: w2 was a zigzag and w4 a triangle. The other thing is that triangles are ending patterns and are recognized by their extreme moves after they finish in both directions. Once the w5 thrust finishes, the trend promptly reverses. We have all of those characteristics here.


This next chart is just bigger picture view showing that we should see significant strength early next week.

This is a daily chart. We have a similar pattern showing up here that also supports our thesis. As it happened in early December when the bears tried like crazy and couldn't get it price to break the key level. The bulls finally wore the bears out and got a nice little rally off of it. Of course the bears won out once they rested, as they will here. Let's just say the next time we visit ES 800 it won't be pretty.

Thursday, January 22, 2009

Not Quite What I Hoped For...But We're Still In It


With today's consolidation, here is where we stand: very close to a big 'ole cliff. The 800 level has held again, and we were able to close above a key level (ES 819) as shown on the above chart. Notice how this level has been tested consistently the last several days. Well, today we closed on the right side of this level if we're going to start rallying. It is VERY important that we stay above this level. In fact, if we were to lose today's lows, then we may end up dropping off the cliff.


This next chart is a 30 min chart and it shows a potential head & shoulders pattern. If this is the case, then we should see some significant lift in the markets over the next few days.