Wednesday, October 27, 2010

First wave complete...


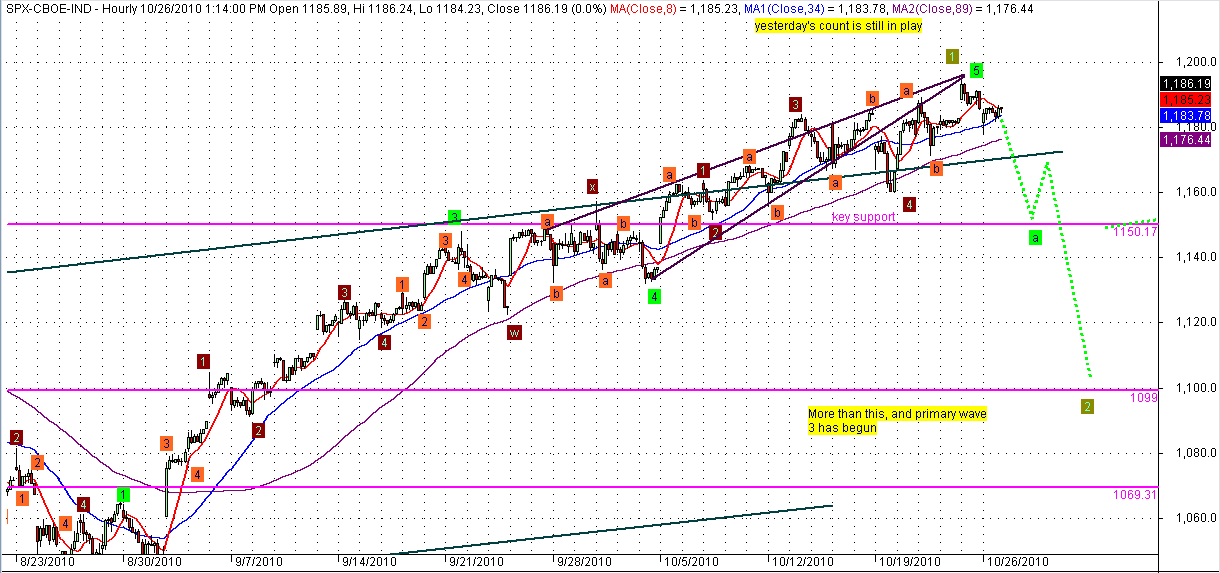
Price action today put in what appears to be a completed 5 wave pattern. Whether it is wave 1 of a larger bearish impulse wave or wave a of a larger bullish corrective wave, we have yet to know. I've mapped out a couple of price patterns that I'll be watching for over the next couple of days.

Best of luck!

Tuesday, October 26, 2010

Stay on target...


...nothing new to report, yet. Let's see where we go tomorrow.

Monday, October 25, 2010

Stay on target...


Well, the market did make one more new high (as was allowed) and has now exhausted the ED scenario with this extended count.

The bullish scenario is that we have just finished wave minuette wave 1. Expect a minuette wave 2 to test the 1100 area.

The bearish scenario is that we had a failed 5th / C wave, and are about to have the first impulsive move of Primary wave 3.

Let's just say that the price patterns from these two scenarios should be easily recognized. Time to call your hand Ms. Market...

Sunday, October 24, 2010

Not much to say...


So here I am reviewing the charts for the week and there is really little to say. The market has been in a slight upwards sideways action now for 8 days. Volatility is bottoming. New highs is diverging from price action, and volume is increasing on the down days. Now, we may have a new high before this next down wave begins as shown on my charts, but it is not necessary.

We should see a test of 1150 this week. If this is a bullish move, that could be it. However, there is a much larger support area at 1100 where the bulls would be able to stage a major rally from.

The bears need to get price below 1100 to take control of the charts once again.

Thursday, October 21, 2010

Still topping...


Well, our test of the 89 SMA and the symmetrical a-b-c turned out enough to eek out a new high. But the market is still caught in the topping pattern I mentioned before. The REAL test of the market will be how it handles the next decent sell off. Until, then it is struggling upstream with what appears a never ending line of sellers above 1180.

Tuesday, October 19, 2010

So far so good...


The market confirmed our completed 5 waves this morning with a great gap down at the open. Our wedge trendline was backtested in the early hours, and then the sellers kicked in. We got a nice little bounce off the 89 SMA, which may provide for a sideways day tomorrow. I'm looking for a test of the 1150 zone tomorrow or Thursday. If there is good divergence on the hourly chart, we may get another bounce. So far, we are still in one wave down structure on the hourly chart, so I'm not going to start labeling until we have some data to work with. Strictly speaking, the 15 min chart is showing a nice A-B-C corrective wave right now. Regardless, this structure would likely be the front wave of a larger 3-3-5 corrective wave. Let's see how it unfolds...

Monday, October 18, 2010

5 waves complete


The back and forth of three waves continue to keep me looking for an ED. With a new high today, we have the setup for a 5th wave. Investor's reaction to Apple's earnings could be the catalyst we need to get some real selling going. The market will show us tomorrow. I continue to look for a test of 1150. I'll be closely watching how the pattern looks going into that price support. If it is a 5 wave, that means we should be able to at least get a test of 1100. If not, then we'll watch the bounce.

Best of luck!