Tuesday, March 10, 2009

Wave 4 has begun...how will it end?

Well, the gap up this morning never looked back. In fact, most of the gain today was made in the first 60 min of the U.S. session. The rest of the day the market kept to a small range and then closed at the session highs. So, now that wave 4 has officially begun, how will it go.

As a primer, corrective waves include:
- zigzags (3-3-5 or 5-3-5)
- triangles (3-3-3-3-3)
- flats (3-3-5)
- combination waves (essentially any of the above waves strung together with an 'x' wave in between.

Also, wave 4s generally tend to be shallow: retracing between 23.6% to 38.2% of the 3rd wave. In addition, wave 4s and wave 2s tend to alternate. So if wave 2 was a zigzag, then wave 4 will not. And finally, triangles only appear in the wave 4 position (not the wave 2 position).

Our finish for wave 3 was messy, and I have two options on how it ended. Depending on how it ended plays into each of the most likely wave 4 scenarios. Since wave 2 was a zigzag, my best guess is that wave 4 would be a triangle or flat. My preference is for scenario 1:


Scenario 1 (above)
Wave 3 ended with an ending diagonal, and wave 4 will likely be a triangle contained at the high of 734, but more likely 725 (and possibly at today's high). We would have finished wave a of the triangle today or tomorrow morning at the latest. We would likely finish the triangle sometime between the end of this week and next.


Scenario 2
Wave 3 ended on 3/3 and we are now finishing off an irregular flat (wave B is longer than wave A). In this scenario, wave 4 should finish off tomorrow am and might reach as high as 734 but likely will be contained by 725. We should also quickly breach 672 tomorrow or Wednesday at the latest if this is the correct scenario.

Our confirmation that wave 4 has ended is a break of 672 as that is the key pivot for this wave.

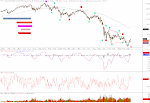
Finally, I have a close up of the 5 min chart (below) showing our latest action. As you can see it is pretty fast and furious - an obvious sign of short covering. Volume has not shown any signs that we have hit any kind of a bottom. I show a likely spot for wave b to end if scenario 1 is going to play out.

Monday, March 9, 2009

Have we been here before?


Well, the nasdaq continued its downtrend by wiping out all the early gains. The financials decided to take a day off and kept the S&P500 above yesterday's lows. I see only two likely scenarios from here:

1: We tread water for the rest of the week (see top chart) and then plunge possibly starting on Friday. At this point, ES can't spend more than an hourly bar below 676 otherwise we will likely plunge immediately. I just don't see any upside rallies likely taking hold, so at best I think we tread water in a w4 triangle. This would set us up for a quick plunge and then a quick reversal as it goes with triangles.

2: We breakdown starting tomorrow (see bottom chart) as the Nasdaq acts as an anchor around the market's proverbial neck. This should push us to the 600 area very soon.

Sunday, March 8, 2009

Do you feel confused? Well, so is the market...

With the rally late on Friday extending as much as it did, it sure makes tomorrow's forecast that much more difficult. In times like these, it is important to go through the facts:

- we're in a downtrend and that won't end until we get some kind of capitulation on high volume (volume on Friday was not impressive)
- Since Feb 9th, every rally has been sold
- the daily SMA is still sitting at 715 and will be taken out during our upcoming w4 (if this is it)
- we are deeply oversold (likely the key reason why shorts decided to take profits off the table late Friday)
- the nasdaq finally began to outperform the spx to the downside on Friday for the first time in over a month
- significant resistance is at 700, 725, 740, and 780
- key retracement levels for a w4 are 715 and 745

So, depending on your trading instruments you have to manage risk differently. For example, out-of-the-money puts that expire in two weeks may need to be sold if the downtrend doesn't continue Monday, but short positions (especially ones that aren't significantly leveraged) could be held comfortably knowing the bottom is still lower.

Now, to the charts...

I'm not sure if I would lean one way or the other as to which chart is my preferred count. I hate 1-2, 1-2, 1-2 counts because at some point you realize that you were wrong more times than not. So here are the scenarios:


#1 The bottom drops out of the market next week. Key confirmation points:
- Friday's low is broken to the down side within the first 2 hours of Monday's session
- We close at the low on Monday
In this scenarios, the bulls finally give in. We should see SPX 600 this week.


#2 We have started our w4 bounce. Key confirmation points:
- When we get our retest of Friday's low (very likely to come) the retest holds. I would count any retest as price moving to the 670 area and holding
- We close above the daily 8 SMA
In this scenario, we will likely chop back and forth. We likey will test our 700 area get rejected, and hold Friday's low. This would be our first clue that 700 will not hold again and we will move the 725 resistance. This wave will likely be a triangle.

Thursday, March 5, 2009

The grind continues...


Bulls couldn't string it together and my call for a minor w2 instead of a larger w4 turned out to be correct. We broke down previous support and then came back up above it at the close. I'm still expecting a major breakdown day (about 10% in one day), and every day seems to be one day closer. Could be tomorrow? Only the market will tell.

For tomorrow I'm expecting a gap down, possibly below today's lows. Should we hold the 680 area overnight, then I expect any rally to be shut down at 690. If the market does manage to put in a reversal, it should be short lived. Since I'm sitting on a significant march put position, I'll be looking to start the profit taking hopefully tomorrow around 650 or lower.

The chart below is showing some additional channel lines that could provide resistance on the downside. As you can see, there is still a lot of downside to go.

Wednesday, March 4, 2009

We're near a crossroads


So the question of the day is...Is w5 of 3 subdividing or are have we started a larger w4 correction. We won't know for sure w/o some more data points. My preferred count (see above chart) right now is that w5 of 3 is subdividing. In this scenario we put in a w2 high in the afternoon, and we are starting w3. This should be pretty easy to spot tomorrow morning as we should be below 700 in the first 60 min of the US session.


The alternate count (see above chart) will be most easy to spot if 704 holds in the first 30 min tomorrow. If not, then as long as 699 holds within the first 60 min, then we will likely be in w4. There will be no guarantees though until we either break today's high or yesterday's low.

Now, if we are in a w4, then we should prepare ourselves for either a triangle or zigzag (or even a double zigzag). Because our w3 has been so shallow compared to w1, I would expect any retracement to also be shallow: 23.6% - 38.2% range, but we could mark 4-5 days completing this correction with today being day 1.

Tuesday, March 3, 2009

Still waiting for something to happen...


Well, today's very unimpressive show by the bulls let us know that the path of least resistance is still down. While we could begin w4 at any time, volume (see daily chart) is still showing us that we are more likely to drop then bounce. We're sitting below the middle trendline (see hourly chart), so maybe that is enough to get the selling moving tomorrow. Wednesdays tend to be trend continuation days. We'll see. My best guess on wave counts is shown on the 15 min chart.

Monday, March 2, 2009

Maybe a bounce tomorrow?


Well, we have technical indicators that are oversold and looking to turn up. We have all the minimum requirements for our w3. The question is do we bounce for our w4 now or do we go down more tomorrow. I guess I put my chips on more down move only because I'm still 100% short. Any bounce will be that a bounce. Why, well volume wasn't particularly high (it has to be for a washout and a solid bottom), I think we still have a lot of complacency in the market (vix still sitting near 50), as much as the market dropped today it was kind of a slow slide not a massive drop off a cliff. We haven't even reached the bottom trendline (see 15min chart) that should end up breaking before this is over. I think we still have a lot of supply (sellers trying to get out a higher prices) in the 730 area. Also, it is important to remember that we have crashed in the past when the technical indicators were showing oversold. That is a hallmark sign of a bear market. Things go from bad to worse right when people think it 'should' turn up simply because the indicators are pointing that way.