Wednesday, September 29, 2010

One more high?


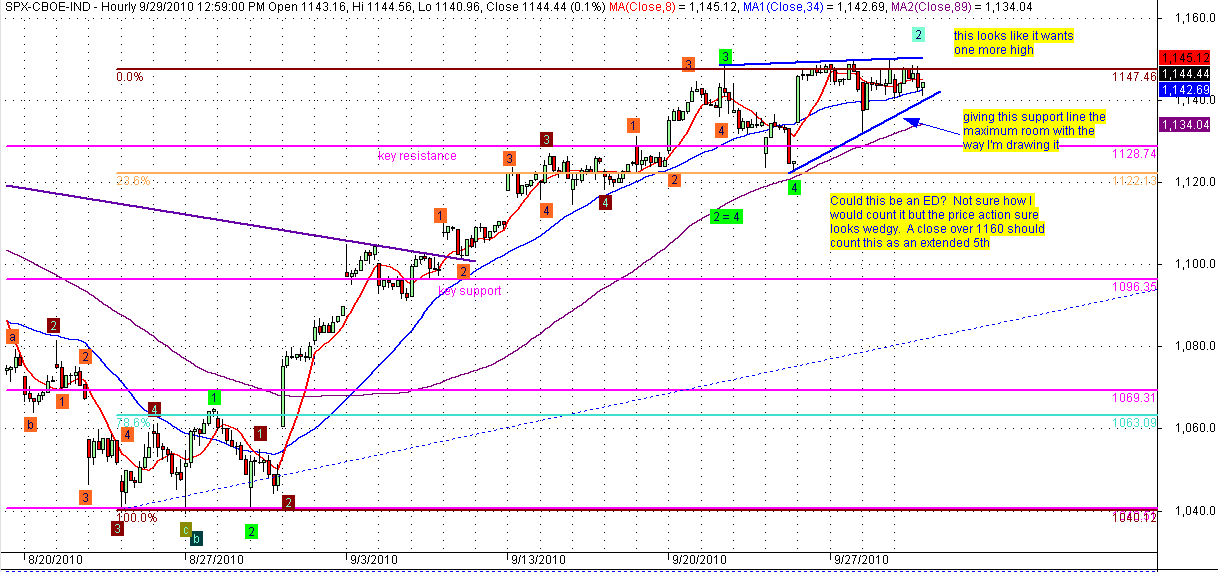
Today's price action just bumped along up and down. I redrew yesterday's support line with the maximum allowed room (low-to-low instead of close-to-close) and that shows us that we don't have a breakdown as of yet.

Price Action looks like it wants to try and get up over 1150 at least one more time. A failed move should give us the trigger we've been waiting for. A solid breakout gives the market that extended 5th wave I've mentioned.

Tuesday, September 28, 2010

Where to from here...


Price action didn't cooperate today after we got some morning weakness. That puts us in a couple different scenarios:

- We are in some kind of ED, and we will get confirmation with a close below today's low.

- We are in an extended 5th wave, and tomorrow we should bust out of the wedge and head towards our price targets.

No reason to get aggressively short here, but I would hold what I have unless we close above 1160.

Monday, September 27, 2010

Daily chart shows 5th wave


Sorry for leaving everyone hanging this weekend. It was a crazy one here, and I never caught up. I did have a few minutes to look at the charts and the daily is flashing a big time 5th wave at today's high. Going from the dailies down to the hourly chart and making some modifications, I now have our subminuette wave 4 ending last week. Do we go to a wave 2/B down now or are we going to start minute wave 3? Price action will let us know for sure.

Target for a wave 2/B down is 1096 area and a daily RSI(5) between 30-40. Target for a minuette wave 1 (assuming minor wave 3) is in the 1000/1020 area with a daily RSI(5) showing divergence with a low in the 20s.

Let the market lead the way - but I sure would like to see minor wave 3!

Thursday, September 23, 2010

Downward pressure continues...


Sorry for no post yesterday...still swamped with work...

We continue to see selling pressure, and it was interesting to see the market bounce right off the lip of my buy zone. I don't see any divergence on the hourly chart, and the daily chart RSI is sitting right in the middle. We've retraced a mere 23.6%. If this is market is strong, then we may not see much more downside action. But the way it closed gives me a feeling that we could get another gap down tomorrow but see a solid down day.

Let's keep watching...

Wednesday, September 22, 2010

5 waves complete


Yesterday's price action appears to have given us the wave 4 I was looking for (official move was almost 9pts), a quick retest 5th wave and another reversal. I'm expecting follow through selling at least to the 1106 / 1122 area in what would be the next buy zone. If, however, price can get below that zone, then there should be a strong move to 1090 as that would be the next key area of support. It's not until price gets below 1090 that the momentum shifts once again from up to down, and we have a good shot at minor wave 3 having started.

Best of luck!

Tuesday, September 21, 2010

Getting very close...


to a confirmation short signal. From the price action yesterday, it appears we have a 5th wave extention. I'm expecting another small 4th wave (in the neighborhood of 7-10pt) before things really get moving. We did have a nice volatility move yesterday, which is actually getting us setup for the bearish move.

We have massive overhead resistance in the 1157/1164 range. I'm not sure we get there, but if we do, then get ready to short.

Sunday, September 19, 2010

After options expiration Friday...


Well, going strictly by the charts, we appeared to have a triangle of some sorts on Friday as the market makers pinned the charts where they wanted them to be. If we break lower Monday, then my scenarios go like this:

Primary: We had some kind of complex subminuette wave 4 and price finds support in the 1105 / 1115 area. This would give us a 15-25 pt correction, test our hourly 34 and set us up for a wave 5.

Secondary: The choppy action of last week was it and we should go down to the 1090 / 1095 area. Anything more than that though, and we are looking at our more enticing bearish scenario.

If we break higher on Monday, then we had our wave 4 and any reversal of a test of the new highs is VERY shortable.

Friday, September 17, 2010

5 waves complete


While we never really got a solid test of the 34 SMA, we did work our way to an oversold condition near the 34 SMA, so that qualifies as a wave 4. Pretty wimpy I know. Look for today's action to put in the top and sell off some and really get started next week.

Wednesday, September 15, 2010

Wave 3 extended


Well, what looked like a good setup for wave 4 never materialized as we never tested the 34 SMA. Instead, I'm labeling as a subdivided wave 4 flat. I'm looking for another test of the high tomorrow for our wave 3 and then a 20-25 pt wave 4.

Morning update...


Another late night...

Okay, based on price action and where we are with the moving averages, I've ditched the subminuette wave 4 and went with an extended 5th wave of subminuette wave 3. That puts us now in subminuette wave 4 with a price target in the 1100/1108 range based on the size of our wave 2. I'm looking for price to solidly test the hourly 34 SMA during our wave 4 (even break it a little). We should then have significant divergence in a wave 5 to finish off our minor wave 2 flat.

Best of luck!

Tuesday, September 14, 2010

Morning Update...


Another late night and here I am. The ED scenario was a bust at the open. We have a high potential of a 5 wave completed pattern. There are a number of different scenarios, so here they are:

#1 5 waves completed at the open yesterday. We had a wave a/1 down and a wave b/2 retracement. Today we will get our wave c/3. If this is the count, then we could have an irregular flat minor wave 2 on our hands, or a bullish minute wave 1. The selloff will tell us which it is. If we are in a minute wave 2, I would expect price to hold the 1096/1100 area.

#2 We are in a 5th wave extention. Any weakness this morning should hold at yesterday's low and reverse to move to the 1128 area.

Monday, September 13, 2010

Morning Update...


Sorry about the early post. My computer caught some kind of virus and incapacitated my main browser (chrome) and IE. Fortunately I have firefox installed too, and that seems to be working, but it cost me my time trying to fix the others.

Here's what I have. We haven't had any solid bearish reversals that have amounted to anything. Volume continues to be light. The market broke out of the trendline channel formed with the previous high/lows last week. We have what could be an ending diagonal forming. We will have a gap up at the open. With that said, here are my scenarios:

1: ED. Price will reverse at the open (potentially a drop and a retest). Key indicators: the opening gap closes and we close below 1105. We should see significant follow through to the downside the rest of the week.

2: 5th wave extention. Price will likely try and close the opening gap but will fail. We should close above 1128 today or tomorrow.

Thursday, September 9, 2010

Bullish still....


We got our wave 3 peak (currently labeled) right at the 786 retracement from the last high. The move off the high was nothing to write home about (as of yet) and as long as any downside action can be contained in the 1091 area, we should have a 5th wave up to test the previously labeled minor wave 2 high.

Best of luck!

At the open...


...sorry for the non-post last night. Another full day and didn't have much in me to review the charts. This will be quick...

The futures are going to have the market jump the trend line that has been providing resistance at the open. Because the retracement yesterday didn't do much, I'm changing my count to have subminuette wave 3 still in progress. That makes micro waves 2&4 have a 1:1.382 relationship. I'm still looking for a 20-25 pt subminuette wave 4 triangle. If the next move down were to take us below Tuesday's low, then that would be bearish.

Tuesday, September 7, 2010

Cautiously bearish...


Price was rejected at the trendline as predicted. So far the market has sold off 14 pts on the SPX and 17 pts on the futures. We are nearing the 20-25 pt wave 4 correction zone I mentioned yesterday. There is lots of setup here for the market to just drop, so I'm keeping my stops tights (1 pt over the hourly 8 SMA). If we're going to run, I'd like to see a 30-40 pt down move either tomorrow or Thursday. If we hold the 1080/1085 zone, then I'll be closing my shorts and possibly dance lightly with the bulls. Let the market lead the way.

Monday, September 6, 2010

Still bullish for now...


Wow, last week had an incredible bid under the market the whole week. We're now overbought and at a key trendline with a wave pattern that appears complete at one level. Based on the size of our subminuette wave 2, I'm looking for a 20-25 pt wave 4 correction (quite possibly a triangle). If the bulls give back much more than that, then we have a nice exhaustive wave C, and the bears will take over fiercely next week.

Thursday, September 2, 2010

Key test coming...


Sorry I don't have a whole lot to say. It's been a couple of long work days, so I don't have much time for deep analysis. What is coming up is a key test of the trend at 1096/1106. We'll definitely get a pull back before or after the 1st test, but if the move down is weak, then the bulls will move and confirm a change in trend from down to up. Watch any pullbacks to hold in the 34 SMA (hourly) for the bulls. A loss of ground here should put the bears back in the drivers seat, and a quick move down to 950.

Wednesday, September 1, 2010

Charts are turning bullish...


Well, the sellers ran out of steam at the goal line, and the bulls took advantage in a massive up day. The charts have turned short-term bullish, but there is still more to go before we are looking at a change of trend. Anything greater than a 10pt pullback from here (before crossing 1100) should put the bulls on caution of a false breakout.

The bullish count is now my primary count. The bearish one is the last stand at 1090.

Best of luck!