Tuesday, March 3, 2009

Still waiting for something to happen...


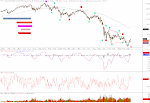
Well, today's very unimpressive show by the bulls let us know that the path of least resistance is still down. While we could begin w4 at any time, volume (see daily chart) is still showing us that we are more likely to drop then bounce. We're sitting below the middle trendline (see hourly chart), so maybe that is enough to get the selling moving tomorrow. Wednesdays tend to be trend continuation days. We'll see. My best guess on wave counts is shown on the 15 min chart.

Monday, March 2, 2009

Maybe a bounce tomorrow?


Well, we have technical indicators that are oversold and looking to turn up. We have all the minimum requirements for our w3. The question is do we bounce for our w4 now or do we go down more tomorrow. I guess I put my chips on more down move only because I'm still 100% short. Any bounce will be that a bounce. Why, well volume wasn't particularly high (it has to be for a washout and a solid bottom), I think we still have a lot of complacency in the market (vix still sitting near 50), as much as the market dropped today it was kind of a slow slide not a massive drop off a cliff. We haven't even reached the bottom trendline (see 15min chart) that should end up breaking before this is over. I think we still have a lot of supply (sellers trying to get out a higher prices) in the 730 area. Also, it is important to remember that we have crashed in the past when the technical indicators were showing oversold. That is a hallmark sign of a bear market. Things go from bad to worse right when people think it 'should' turn up simply because the indicators are pointing that way.


Saturday, February 28, 2009

Wile E. Coyote Anyone?


You know the story. The roadrunner zooms by and Wile E. Coyote is hot on his trail. Next thing you know the poor coyote has gone off a cliff. He hangs there as if suspended for awhile before he realizes there is only one way this is going to end -- badly.

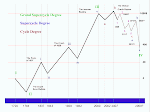
Well, the bulls have been fighting gravity for the last several weeks. They have now been pushed off the cliff with Friday's close. After our very brief (as in what 3 days?) double bottom bounce, we have now closed BENEATH the November lows. The last time the SPX closed here was 12 years ago?! So, in honor of this momentous occasion, I thought I would put up a long term chart of the SPX.

I think a picture like this just makes you sit back and wonder, how did we get here? Yes folks, the parabolic rise we have experienced from the late 80s was due to our gov't running the credit spigots overtime. And now we have come to realize that we can't make payments on this mountain of debt we have created. There is only one way out from this mountain of debt, and that is either through default or paying it off. Both are painful. Both are a reality. And no president and congress are going to solve this with 'stimulus', 'bail outs', or other spending activities that will eventually destroy our currency.


With that rant over, let's move on to the charts. I'm currently counting us somewhere in w3 of 5. Depending on how this last piece of w3 goes (we could subdivide some more), it will likely be over with a close above the hourly 8 SMA. Since we have yet to see selling accelerate, I'm expecting it to begin on Monday. However, the bulls have rarely rolled over so easily, so we won't be able to count the current wave complete until we get an hourly close above the 8 SMA, which I expect to occur around the 650 area. If that happens without selling capitulation, then we will likely have an extended wave 5 that will do the job.

Thursday, February 26, 2009

Our first key structural low broke near the close of today


With ES 751.25 being broken today (today's low was 750.25), that was our signal that this minor wave 4 is over. Since our larger wave 3 has yet to accelerate to the downside, I would expect our wave 5 of this wave 3 would do the job. If it doesn't, then it will occur in the larger wave 5.

My best guess for tomorrow would be a gap down without a fill. However, if we don't, then we'll likely subdivide this wave too. Look for rallies to die at 770 or below. Any strength should be erased in the first 90 minutes of trading the US session. The bulls best case scenario is that we just put in a flat b wave, and we're going to make one more attempt at 780. I'm not saying that it would happen, only that it is possible.

This wave 3 should touch or break the bottom trendline, see the 60 min chart, (the actual value is below my chart, sorry), but I would venture a guess in the 600-650 range.

Wednesday, February 25, 2009

This minor wave 4 'looks' over


Well, the move off of yesterday's high 'looked' so impulsive on the 1 min chart. But, if what looks to be an impulsive wave does not take out a prior high or low (in this case low), then it always becomes suspect. And it turns out that this is one of those cases. Well, looking at the pattern on the 5 min level (see above chart), we have all the makings of a finished wave 4 except one: a new momentum low. To achieve that we need to go below ES 751. If the pattern is indeed finished, then I count it done with a running triangle to finish wave C. At this point wave C = wave A*.786, which is a valid fib relationship. Also, you'll note that price stayed below 780, which is where I thought any rally would die. So...with fingers crossed...let's see if we can take out that low tomorrow morning and get some real selling going.

Now, if we break today's high, then the next major resistance line would be in the 785-790 area. So there is still a lot of work for the bulls to go before they can even think of declaring a double bottom. Taking out 741 will erase those dreams and should get some acceleration to the downside.

The two charts below are my updated 15min and 60min charts as it is always nice to look at the big picture. The fact that we broke out of the channel doesn't worry me yet, as a false breakout is very bearish, and that is where I'm placing my bets.


Tuesday, February 24, 2009

Still in the channel...


With today's w4 rally, we are now touching the upper trendline once again (see above). I suspect we'll make one more attempt at it tomorrow, but the indicators are already rolling over. Once the rejection of the trendline is in place (I don't expect any rally to actually stay above ES 780 if it even gets that far), the sell off should actually accelerate to the bottom trendline shown on the hourly chart (not the middle trendline that we touched yesterday).

Monday, February 23, 2009

Some nice selling today, but we're not even close...


From the opening bell, the sellers took over and pretty much owned the bulls the whole day. My low target of 785 did get hit during the European futures market (the high was 786). With a low at 741, it looks like the bulls are now playing a double bottom, but it won't hold. To many sellers left and not enough buyers to sustain anything. There is nothing in the pattern that requires further downside action tomorrow; however, we are in a 3rd wave, so there are certainly odds of more selling.

Here are my scenarios:
- If we can close above 755 on an hourly bar in the two hours of the US market, then we are likely in another wave 4 and will try and hit my targets of 770-790.
- If we can't do it, then selling should accelerate at least to the 720-725 area. We are getting oversold on a number of indicators; however, we haven't gotten enough oversold yet to get worried of a sustained rally. Besides, we're in a bear market. Oversold can become more oversold and so on and so forth.