Friday, January 9, 2009

Is the Bear Rally Over? Not Likely...

Well, we're very near some critical levels for the Bull Case (bear market rally) to hold. Here are the key areas and numbers:

- Trendline up from the lows just below (in the ES 875 area)
- The 61.8% retracement (ES 887)
- Strong support at ES 880
- A fib relationship of C=A*.618 at ES 882
- A fib relationship of C=A*.786 at ES 875
- The 78.6% fib retracement at ES 872
- A fib relationship of C=A at ES 865

Let's not forget that it is OPEX next week, so there will be every reason to get the market to rally. At the end of the day though, if ES 852 gets penetrated, then I'll mark the rally complete and start shorting every bounce.

Now, since we're looking for a reversal, it won't be safe to really go long until we have one. Without the benefit of Monday's price action, the current key reversal level is ES 898.25 with a confirmation at ES 910.

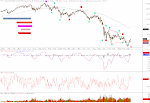
With that said, here is my updated 60min and 15min charts. I hope this retracement has been profitable for everyone. I know my account has recovered nicely ;-).


Thursday, January 8, 2009

Today Looked Like Consolidation...


It was a choppy day and had the look of consolidation. I expect a little more strength tomorrow morning before we reverse to one more low near the support line possibly around ES 880. The Nasdaq has been showing relative strength through this whole process and will likely lead the charge up. At this point it is important to watch for signs that we are off to new highs as we have reached the minimum retracement targets (50%+) on both indices. If ES 920 falls, then that might very well portend that we are in the next move up. My initial target is ES 960-965 range.

Wednesday, January 7, 2009

Is the drop over? Not Likely...


With today's gap down below key support levels, this was the only message a trader needed: we are going down today; and so it went. Now, the question is: Is the drop over and can we resume our bear market rally? One look at the daily chart (top chart) says not likely. Think of it as a rock that has lost all upside momentum, came to a standstill, and started it's acceleration back towards earth. One day will likely not stop it. Instead, I think probabilities are high that we have a consolidation day tomorrow (looking at the last two candles on the hourly chart), then we resume our downwards path towards my targets. We nearly touched the 50% retracement level today on the ES, although the NQ was showing relative strength. I think we are likely to test the supporting trendline before we stop our fall and can move back towards the top.


These two scenarios are my best two guesses for tomorrow. Consolidation and a retest of 918 (#1) or a gap down selling climax (#2) with an intraday reversal.

Tuesday, January 6, 2009

Could it be finally over!!??


This bear market rally has really pushed the limits and my constant harping of a turn down has cost me in my trading account. However, we did get some signs today that this might finally be over. The Nas100 did make a slightly higher high in the afternoon while the SPX did not.

One of two things happened here:
- we are in a corrective flat formation and we should see new highs tomorrow
- it was a failed wave C on the SPX and we should test the key support areas labeled on the two graphs (this is how I'm positioned)

Anyway, I have two charts, both 15min. One of the Nas100 futures and one of the SPX futures. Both tell the same story a little differently. It is possible that we completely breakdown from here, so if we get more than a 61.8% retracement or an impulsive look then that could lead us to new market lows in January. Not likely (yet), but a scenario that should be in the back of your mind.

Monday, January 5, 2009

Wave A Looks Complete


With today's action comes a couple of things. First, that the wave 'A' of this final structure looks complete. A move below today's lows will confirm it. Should we move above today's high, then the upside from here is likely substantial.

The first picture is the latest 5min chart showing the wave structure complete. Throughout this up move I have contended that the wave structure looks motive and not impulsive. This is an important distinction as the next wave will be a wave C and not a 3rd wave. While C waves can definitely be like a 3rd wave in intensity, we are likely to experience a C wave that is somewhere between .618 and 1.0 the size of wave A.


This picture (1min chart from today) is my evidence that we had a motive wave. Today's B wave triangle can only happen in a motive wave. Since it was part of the up move, then it has to be part of this current wave structure.

Sunday, January 4, 2009

The Future Looks Bright - Not Really

With the market going from an overbought condition to an even more overbought condition on Friday all while breaking through a key support level (you can only dream of this during holiday traffic) without even flinching, all three of my market forecasts just went out the window. However, at least things looks a little more clear today than last week as to intermediate term market direction. And that direction is up, at least for a little while longer.


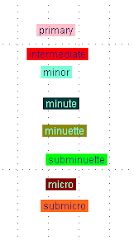
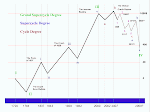
The above picture is how I see the near term direction. We are still massively overbought on all time frames and are due for a nice pullback. However, I expect the pullback to be at least 50%, but possibly not much more. But, the only place I'm willing to draw definitive line is the low on the 29th. That should not be violated on this pullback. There will be plenty of time for that. After that pullback we should see a steady move towards a 960 target. It is possible we go much higher, possibly even to 1030 area, but probably not much higher than that. Once this move fizzles out, we will move down to new market lows in a wave 5 to complete primary wave 1/A (still not sure if it is a 1 or an A). I've updated my longterm wave count also, so you can see how bearish I really am. Possible targets on the SPX reach as low as 400 over the next several years.

Thursday, January 1, 2009

We lost our impluse ;-(!


Let's start our discussion with what happened on Wednesday. What looked like a nice impulse wave gave way to a nice ABC. How you might ask? Didn't it just keep going up? Why yes it did, but as it did it lost all kinds of impulse wave attributes and took on motive wave attributes. In my wave counting I have learned that certain wave attributes commonly appear along with the technical indicators. The picture above describes all the areas that are 'red flags' for me in counting the last move as an impulse move. Now certainly I could be wrong on this. And if I am, I would expect us to take out ES 918 early next week. However, this is depicted as my scenario 3 wave count.


The 2nd picture is the same price action on a 15min chart. I think it better tells the story of an ABC. The 3rd picture is the same thing on the 5min chart with the appropriate Fib relationships labeled on the chart along with the anticipated price action.

Now for where I think we go from here. I have three 60 min charts shown in order of preference.


Scenario #1: B wave triangle. This certainly has all the makings of a B wave triangle and should get wave e down to ES 855-860 area before making a massive reversal to the upside. Our wave 4 target would be in the ES 940 range and then another quick reversal to wave 5 lows that would eventually end our Primary wave 1/A bear market and give way to a 3-6 month rally to SPX 960-1050 range to finish off Primary wave 2/B of this bear market.


Scenario #2: B wave ZigZag. In this scenario we likely close the SPX 800 gap before moving higher to a wave 4 target of SPX 960.


Scenario #3: B wave ended with a failed wave C and after a 50-61.8% retracement we move to our ES 940-960 target to finish off wave 4.