Tuesday, January 20, 2009

Impulse Wave Confirmed


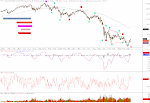
With today's drop, we got our preferred scenario. We have now met all the requirements for an impulse wave except one: confirming that it is complete. Closing above ES 815 on a 30 min basis is probably the first clue that the wave is over. Getting over ES 853 will be our 2nd. We should get some kind of scary short covering rally that will push this up to retest the breakdown of the trendline around ES 910. Not sure we actually get that high, but it is possible. I will start acquiring my Feb/Mar puts starting around ES 880. I will likely put on a 2x position in this order: 880 (1/2), 890 (1/2), 900 (1/2), 910 (1/2). If we break 940, then I'll be looking for the next down move to exit.


Here I show the bigger picture with the 60 min chart. This wave should end with some massive capitulation. Look for a move down to SPX 550-650 range. We will need this to set the stage for a multimonth bull rally to the SPX 1000-1050 range.

Monday, January 19, 2009

The Really Big Picture


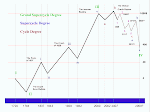
I've put together a nice timeline showing the different bubbles during this grand supercycle rise. We are almost to the end of that first wave 1 (target SPX 600) from the 2007 high. We probably work through this cycle wave C by 2012-2014.

It is important to note that the last grand supercycle crash was the South Seas Bubble, and it lasted 64 years (1720-1784). From there we experienced two supercycle crashes: the panic of 1837 (lasting 6 years) and the crash of 1929 (lasting 3 years - from a stock market perspective). Both were considered 'Great Depressions' although the depression of '29 is the one everyone thinks about (likely because it was much more modern). We are now experiencing another Grand Supercycle Crash that will likely last 40-60 years. This is definitely not a buy and hold environment!!

I've scaled the numbers on the right with levels of the Dow Jones Industrial Average. I've estimated levels before it was actually created to give you an idea on where we've come from. Also, the scale is a log scale not a linear one so the spaces are not to a linear scale.

I'll keep this chart updated on the right handside in the future.

Sunday, January 18, 2009

Where do we go from here?

So I have a couple of different open scenarios that I'm watching after last week's drop to the downside.

This is my preferred scenario is that our wave 4 has finished and we are in the final stages of w1 of 5. However, I have not yet counted the structure complete. I see one more need to retest the lows put in last week with either a failed 5th wave or a lower low (doesn't matter how much lower only that it is lower). From there we would move to retest the breakdown from the last trendline in a w2.


This is my 2nd scenario. We move up strongly from here and complete an impulsive wave to the upside as part of a w1 of C scenario. If this were to happen, then our big entry point would be on the pullback. A possible move SPX 1000 or more could be in the cards if this were to happen.

Some Elliott Wave Basics


I've received a number of questions about Elliott Wave Patterns, so I thought I would do a quick post showing the most basic EW patterns and how they are labeled. Hopefully this will help those who are new to EW identify with some of the jargon I use in my posts. I am happy to answer all questions.


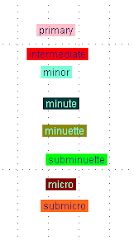
The basics of a corrective wave is 3 moves (A-B-C). Within the context of EW, we talk about 'degrees of trend'. You'll notice that each wave can be subdivided into smaller waves. That is why I use different colors on my charts to match different degrees of trend.


I try and look at the different indices to identify failed 5th waves. If we make a new low on the Nasdaq but only got close on the S&P500, then I would count the S&P500 as a failed 5th wave.

Wednesday, January 14, 2009

Didn't I Say Something About Look Out Below?


At the end of my post yesterday I mentioned that if we broke yesterday's lows it would be look out below. Boy was it ever and more. We gapped down big and never looked back. With ES 852 out of the way I think it is safe to say that wave 4 is over and we are nearing the end of wave 1 of 5. From the looks of things it doesn't look over. We can either move up from here or move down slightly from here but we should manage some choppiness up to the 38.2% retrace level before we head down and test ES 815 to finish off w1. That should give us some nice divergences, because right now, I'm not seeing anything significant.

Here are updated 15min and 60 min charts with my forecast on how we move from here. On the move up to ES 890 I'll be loading the boat full of high beta puts (i.e. aapl, gs, abx). Should be a good chance to make 10x on your money.

Tuesday, January 13, 2009

New Highs In the Works?


We got a little rally in the morning and then new lows for this downtrend later in the day. At the end, it appears we got a nice reversal pattern at the close. Assuming this current wave is over, I took the liberties of analyzing the structure of both the Nas100 and SPX to look for clues as to how to best label this down move. My best label was a corrective wave. The Nas100 gave me the best clues, but in both cases you could practically cut the move down in half at my label B. Plus, we got overlapping waves on the Nas100 which can only occur in the last wave of a move, which I labeled as a C wave. But all this is conjecture until we get a confirmation. I'm looking for ES 910 on the upside before we see any new lows. Should that not happen, then look out below.

Monday, January 12, 2009

Tomorrow is VERY important

With ES trading down all the way to 860.25 today that puts us very close to our confirmed sell signal. Essentially, price needs to continue to strengthen from today's close and quickly get above our 910 level to keep the bear market rally alive. I've put together two different counts based on what we might see tomorrow. But the implications are significant.


In this scenario, we count the corrective move as complete and will strengthen throughout the remainder of the week and likely into the inauguration next week. We will re-test the previous highs, likely make a slightly higher high (possibly to ES 960) to finish off wave 4 and then begin a decent into new lows.


In this scenario, we count wave 4 complete. After a little strength tomorrow morning, we break down again and test ES 850 area to finish off wave 1 of 5 (or 1 of 1 of 5) and then do a retrace the rest of the week and into inauguration (likely 61.8%+) and then move down hard in wave 3 of 5 (or 3 of 1 of 5 depending on how this subdivides).