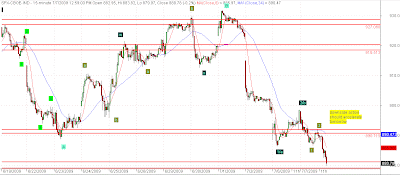
This first chart shows the big picture. While I currently have the waves labeled minor wave A and B with us currently in C, there is a more bearish alternate that I will bring up should one of two things happen:
(1) We put in a 5 wave move on the daily chart, or
(2) Wave C breaks 780, which means that the daily price action does not cross the 8 SMA before hitting 780.
Otherwise, I'm expect wave C to end somewhere between 815-840.


This second chart shows an up close view of the price action. Notice how price continues to respect the red zones I have put on the chart. Now in the third chart I have added a new zone, which is a key zone on the intraday charts. I expect price to find some key support in this zone but to eventually go through it.


0 comments:
Post a Comment